This is a continuation of my teardown of my invented startup, Good Neighbors. A lot of people agonize over how to talk about the size of the market so I did one from scratch including my thought process along the way. By the way, I’m still hoping someone builds this app so I can borrow my neighbor’s cultivator (but they can totally use my power washer).

Subscribe for free to receive weekly posts about pitching, a copy of my ebook Pitching a Leap of Faith, and invites to my Pitch Masterclass.
Bottom up analysis
I did a bottom up analysis, limiting myself to Google searches and one hour of effort. You will want to do more but I wanted to show this doesn’t have to be a huge research project.
I used the TAM/SAM/SOM format but cheekily removed those labels because who cares. I define the Good Neighbors market as “surburban homeowners” because the focus is on people with driveways needing power washers, not condo dwellers who want to borrow your electric toothbrush.

Not everyone is “neighborly” which I define as being open to knocking on your neighbor’s door to borrow something. It turns out more than half of people would do this (the other half do not like their neighbors).
Further, I think homeowners in smaller cities are more neighborly than in big cities. No data, just trust me.
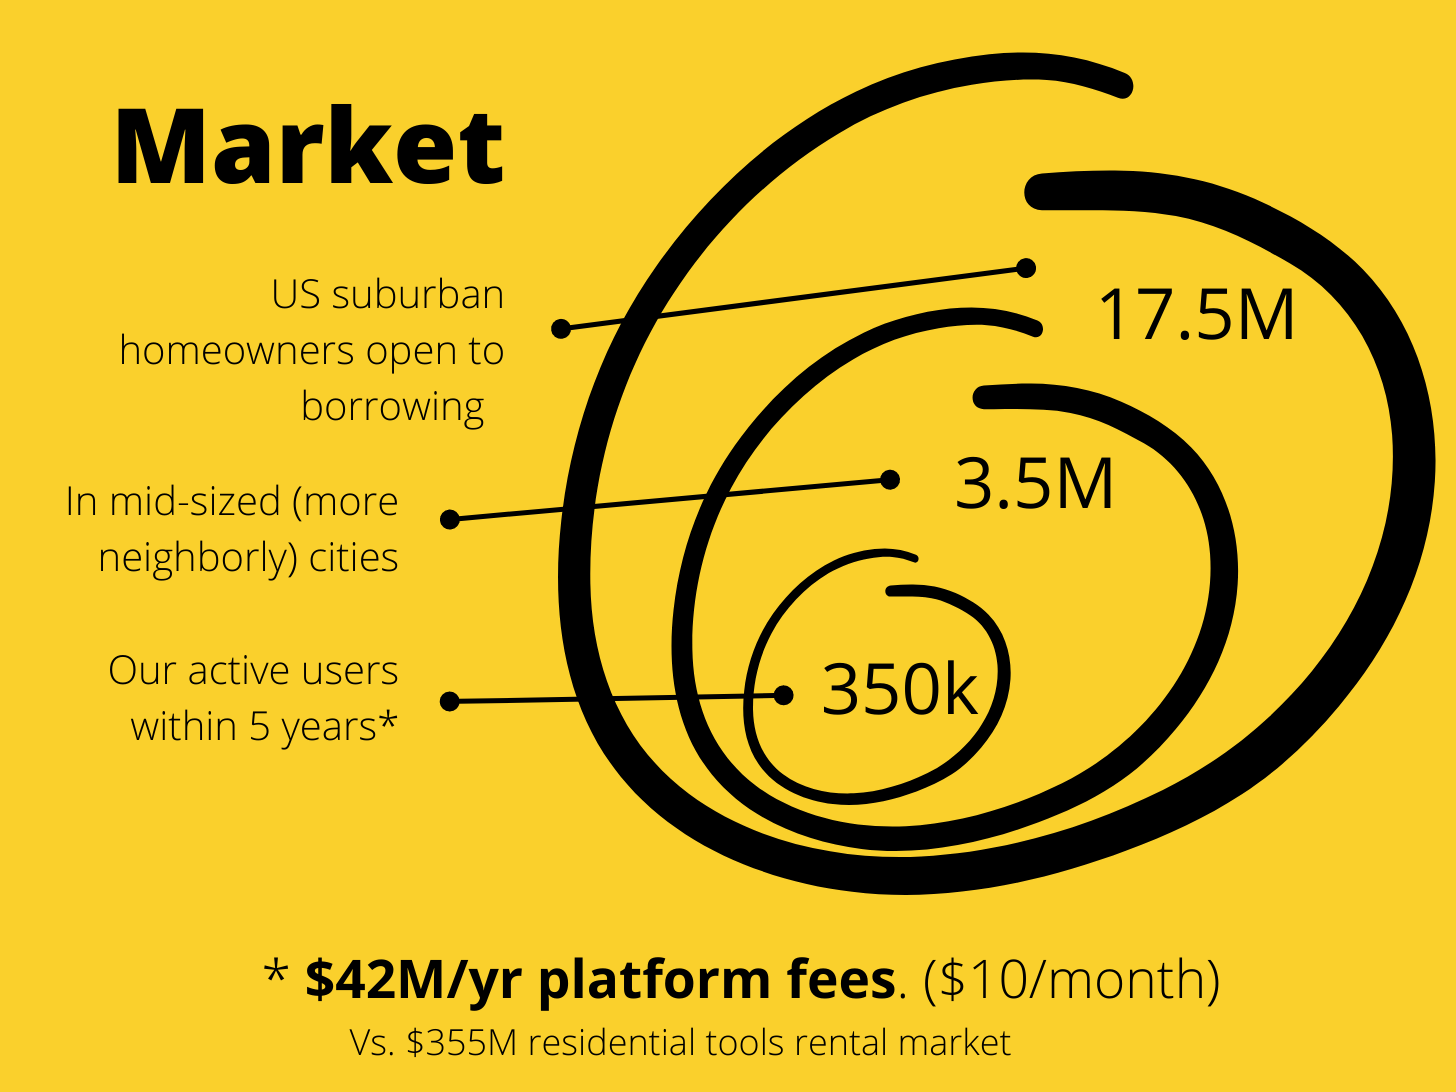
So there’s a huge market (17.5M homes) and a big market even in our chosen target (3.5M homes in mid-size cities). At $10/month for our platform (actual rentals are free) and 350,000 users, this is almost $50M within 5 years.
That’s a pretty big market of good neighbors. I added the $355M residential tool rental market to show what homeowners are already spending to rent one category of goods. We can be even bigger.
Overall, there are a lot of holes you could poke (or drill) in this market sizing. I didn’t explicitly say our TAM is $1B. I made some leaps of logic. But there is solid reasoning behind this slide. You only need to show there is a sufficiently big market to grow your startup.
How I got my numbers
Since this is not a real startup I didn’t have the pressure of actually believing my numbers, but they ended up being pretty believable.
Total Addressable Market (TAM)
17.5M suburban detached homeowners who are open to borrowing from their neighbors:
- 64M detached homes in the US [Source: Urban Institute]
- 52% are suburban [Source: Office of Policy Development & Research]
- 53% of neighbors would borrow/lend [Source: Neighborhoods.com]
- 64M X 52% X 53% = 17.5M target homes
Target Market (or Serviceable Available Market, SAM)
3.5M in mid-sized cities:
- 441 midsized cities of less than 500,000
- representing 20% of US population [Source: Metro Ideas Project]
- 17.5M X 20% = 3.5M target homes
What We Can Achieve (or Serviceable Obtainable Market, SOM)
350,000 active users paying $10/month = $42M/year within 5 years:
- 3.5M X 10% projected market share = 350k
- 350,000 x $120 = $42M/year
Extra: Existing Tools Rental Market
I calculated how many homeowners rent power tools to estimate the size of the total “stuff rental” market:
- $3.7B: Total small tools rental [Source: The Motley Fool]
- 37% residential, 26% N. America [Source: Grand View Research]
- $3.7B X 37% = $355M residential tools rental market
- X 3 to get to an estimated value of all the stuff borrowed from neighbours
- $355M X 3 = $1.065B+ spent renting/borrowing
Multiplying by 3 is not exactly scientific, but it’s not unreasonable if I can make the case that there are many other categories of stuff one might want to rent. By the way, I could have used this $1B as my TAM for a top down analysis.


